Earl September

My photo
I write what ever comes to mind. Real is me and my views/opinion. Be Yourself, be REAL Open-minded young South African who loves to follow South African politics and social issues. I try not to limit myself as I'm capable of more than where I'm now.

Tuesday 14 January 2014

Western Cape honour Class of 2013


Western Cape honouring top 2013 matrics per subject, most improved schools, top schools and top matric candidates:
  • Bishops High takes Bronze in school awards
  • St Cyprian's High takes Silver in school awards
  • Herschel High is province's top school for 2013
  • Klein Nederberg Secondary wins Bronze as most improved school 
  • Imizamo Yethu Secondary wins Silver as most improved school 
  • George High is most improved school for 2013
  • De Kuilen High wins Bronze for Bachelor passes
  • Schoonspruit Secondary wins Silver for Bachelor passes
  • Mondale High is top school for increase in Bachelor passes
  • Strand High most improved in Maths
  • Paul Roos Gymnasium has most Maths passes
  • Punt High most improved in Physical Sciences
  • Paul Roos Gymnasium has most passes in Physical Sciences
  • Spine Road Secondary most improved in Accountancy
  • Spine Road Secondary most improved in Accountancy
  • Spine Road Secondary most improved in English Home Language
  • Fairmount High has most English Home Language passes
  • Klein Nederburg Seconday most improved in Afrikaans Home Language
  • George Secondary has most Afrikaans Home Language passes
  • Imizamo Yethu Secondary most improved in isiXhosa Home Language
  • Bloekombos Secondary has most isiXhosa Home Language passes
  • Bianca Nel, Jan Kriel School, is top Elsen candidate
  • Zimkhitha Basana, Inkwenkwezi Secondary, is top in isiXhosa
  • Robyn Paterson, Rustenburg GHS, is top in English
  • Wianke Jenkins, Durbanville High, is top in Afrikaans
  • Samuel Wolski, Bishops, is top in Mathematics
  • Gerben Draaijer, Paul Roos Gym, is top in Physical Sciences
  • Gerben Draaijer, Paul Roos Gym, is top in Accounting


Monday 13 January 2014

State of some graves

I recently went to visit my grandma’s grave again, after paying my respects and putting on new flowers I walked around and was kind of shocked at the state the graveyard is in.
Is this really the state of the site where people are suppose to have their final resting place, is what went through my mind.

Wait lemme start again……
The cemetery is on a hill and the infrastructure is of such a nature, when it rains the graves – not can’t but – some wash away.
This is not a problem that was discovered recently and I partially blame the local authorities as they the actual caretaker of the cemetery.
However, majority of the blame I put at the door of those selling you the plots and the undertakers.
Surely if you work with the grave-sites in the cemetery, on a daily basis you know how it looks – it seems as if this is not the case.
While at the cemetery, I noticed that the cross of one of the graves, next to my gran, with the rain and all washed away. A few feet from there the tombstone of another grave is skew as the grave cave in.

So what would the solution be?
Digging up every grave that has been affected and re bury them at plots that won’t wash away? This seems like an answer many would possible suggest.
Laying a loved one to rest is a painful experience and how much would it not be to dig up that person’s grave and re-bury at another spot.
One might not be able to do something about the current graves affected but the local authorities with all other relevant stakeholders can do a study/test on how the water would run and possible build water-walls – even around the graves. One could even say not to bury at the area affected.

Your final resting place is not only where you find peace and comfort, it’s where love-ones can go – but how sad is it to arrive at a grave-site that is either half or washed away.
Hopefully the problem gets fixed before we all washed away.


DO WE REALLY NEED TO PROTECT OUR OWN FINAL RESTING PLACE TO AVOID BEING WASHED AWAY?!

MY goal in life


A new academic year starts this week. Wait......!!!! we call it school year.
It’s also one with a new challenge, entering a new environment if you new on the grounds. If you lucky you the new teacher, if not it means you grade 8 or R, or at a new school.
I still remember my first school day, similar to what you see these days for our grade R and grade 1 learners, just in my day we called it pre-primary and sub A. The fear of starting something new was again with me when I started standard 4 (now it’s known as grade 6) at a new school and then came high school with all the standard 6 (grade 8)-kids going through orientation – miraculously I survived this. If you ask me how, I guess it is true “it’s who you know and not what you know”. Five years later the fear of a new start was on my door step again, after completing my high school career I went on to a tertiary institution.
Some of us when we young and others still in their twenties are unsure of our purpose in life and where you heading and we thus feel as if our life is on autopilot, taking each day as it comes, falling into a routine.
This might be the case but the bible teaches us God has a purpose for each one of us. Our fingerprints and DNA are proof that God created us each unique with a talent. In Isaiah we read “God called me before my birth, when I was in my mother’s womb he called me on my name” and 1 Corinthians 12 tells us God has a task for each one of us.
Throughout our school career we meet and greet teachers some of them busy with their hobby trying their best to teach us the quality of life, others try and do their job.  Even they don’t realize the impact they have on our lives.
During a teacher strike a few years ago, I made the statement “instead of our teachers being on the streets protesting which is a good option but they might not get the increase or being paid for that time, they could have been in the classrooms educating our learners to become better leaders looking after their followers.”
It is important to always try and inspire, motivate and encourage a person, someone once told me “the fruit of your harvest you might not see today or in a year but someday could even be after you left earth your motivation, inspiration or encouragement to that person will bear the fruit.”
Through all these phases that so many go through annually at whatever stage I went through there’s one thing that motivated me, MY goal in life!


Thursday 9 January 2014

Supplementary Exam 2014 Info

Candidates who qualify for a supplementary examination can register at the centres where they sat for the examination immediately after receiving their results.
The closing date for application for the supplementary examination is Friday, 24 January 2014.

Who may apply to register for supplementary examinations?
Candidates that have not met the minimum promotion and certification requirements, but who require a maximum of two subjects to obtain the NSC;
Candidates who could not sit or finish the examination due to medical reasons, a death in the immediate family or some other special reason, provided documentary evidence is submitted; and
Candidates, who are one requirement short in satisfying the minimum higher education or higher education faculty requirements or short of one requirement for a specific occupation that they wish to follow. Documentary evidence must be submitted.

The Department has also made available the NSC past examination papers and study guides, and Provincial Education Departments will be offering support programmes, where feasible.

What can I do if I do not qualify to write the supplementary examination?
Those who have not succeeded in their examinations and who do not qualify for the supplementary examination must re-enrol at a school without delay, as long as they meet the age requirement (which is under 21years of age);
This will give them a second chance at writing their Grade 12 NSC. With additional effort, they will succeed;

Grade 12 learners, who failed and who are over 21, should register as part-time candidates or enrol at Adult Education Centres. Participation in programmes at these centres is free and is available for young people and adults who have not completed their formal schooling

In addition, they could explore other vocational options. There are 50 public Further Education and Training Colleges spread across all provinces of South Africa comprising of over 300 campuses or teaching sites. Public Further Education and Training (FET) colleges offer vocational training courses and qualifications at various levels of study for learners who have a Grade 9 pass/certificate, an NQF level 1 qualification or a Grade 12 certificate; and FET Colleges also offer courses (the NATED or ‘N’ Courses) which when, combined with practical work, lead to a qualification as an artisan in a wide variety of fields.

Supplementary Exam Timetable 2014

Wednesday 8 January 2014

Western Cape Matric Results 2013 Per School

Western Cape Matric 2013 Pass Rate Per School, per district

Cape Winelands District:
Al-Azhar Institute Of Paarl: 62.5%
Ashton Secondary: 76.7%
Ashton Public Combined: 82.1%
Bella Vista Secondary: 76.7%
Bergrivier Secondary: 86.4%
Bloemhof Secondary: 100%
Boland Landbouskool: 100%
Bonnievale Secondary: 100%
Breerivier Secondary: 64.4%
Ceres Secondary: 81.9%
Charleston Hill Secondary: 71.7%
Charlie Hofmeyr Secondary: 99.2%
Cloetesville Secondary: 81.9%
De Kruine Secondary: 67.8%
De La Bat-School: 100%
Desmond Mpilo Tutu Secondary: 69.3%
Drostdy Secondary: 98.8%
Esselenpark Secondary: 96%
Franschhoek High: 89.7%
Gimnasium Paarl High: 99.6%
Goudini Secondary: 90%
Groendal Secondary: 72.5%
Boys High: 100%
Hugenote High: 99.4%
Ihlumelo Junior Secondary: 84.3%
Iingcinga Zethu Secondary: 65.5%
Kayamandi Secondary: 85%
Klein Nederburg Secondary: 91.4%
Kylemore Secondary: 71.9%
La Rochelle Girls High: 100%
Labori High: 94.2%
Langeberg Secondary: 84%
Luckhoff Secondary: 87.7%
Makupula High: 92%
Masakheke Combined: 80.6%
Mcregor Waldorf: 100%
Montagu High: 100%
Montana High: 100%
New Orleans Secondary: 86.3%
Northern-Paarl Secondary: 88.7%
Paarl Girls High: 100%
Paul Roos Gimnasium: 99.2%
Paulus Joubert Secondary: 93.5%
Pionier-School: 100%
Rhenish Girls` High: 100%
Robertson High: 100%
Roodezandt Secondary: 87.5%
Skurweberg Secondary: 88.6%
Stellenbosch High: 100%
Stellenzicht Secondary: 50.7%
Tertia Theron Privaatskool: 100%
Tulbagh High: 100%
Van Cutsem Combined: 62.1%
Vusisizwe Secondary: 50.2%
Waveren High: 83.3%
Wellington Secondary: 74%
Weltevrede Secondary: 80.3%
Wolseley Secondary: 92.9%
Worcester Secondary: 87%
Worcester Gimnasium: 98.9%

Eden District:
Albertinia High: 100%
Aurial College: 72%
Bastiaanse Secondary: 64.7%
Beaufort-West Secondary: 83.5%
Bridgton Secondary: 88.6%
Calitzdorp High: 100%
Cape St. Blaize Independent: 93.8%
De Rust Secondary: 94.4%
Dysselsdorp Secondary: 87.5%
Fezekile Secondary: 78.8%
George Secondary: 86.5%
Gerrit Du Plessis Secondary: 88.5%
Groot-Brakrivier Secondary: 92.1%
Haarlem Secondary: 62.5%
Heidelberg High: 100%
Hillcrest Secondary: 87%
Imizamo Yethu Secondary: 86.3%
Indwe Secondary: 80.4%
Kairos Secondary: 98.2%
Knysna Secondary: 86.3%
Knysna High: 97%
Ladismith Secondary: 82.1%
Ladismith High: 95%
Laingsburg High: 88.9%
Langenhoven Gimnasium: 99.2%
Langenhoven High: 100%
Mandlenkosi Secondary: 86.5%
Morester Secondary: 85.9%
Murray High: 59.9%
Murraysburg High: 69.2%
Oakdale Landbouskool: 100%
Oudtshoorn High: 98.5%
Outeniqua High: 100%
P.w. Botha College: 94.7%
Pacaltsdorp Secondary: 94.1%
Parkdene Secodnary: 91.2%
Percy Mdala High: 68.1%
Plettenbergbaai Secondary: 81.1%
Punt High: 100%
Sao Bras Secondary: 97.2%
Sentraal High: 98.3%
Shalom Academy: 100%
Thembalethu Secondary: 69.2%
Uniondale High: 90.3%
Wittedrift High: 100%
York High: 100%
Zwartberg High: 100%

Cape Metro District:
Al-Azhar Institute - Cape Town: 83.3%
Alexander Sinton Secondary: 98.1%
Arcadia Secondary: 87%
Athlone Secondary: 81.8%
Beauvallon Secondary: 41.9%
Belgravia Secondary: 90.1%
Bishops High: 100%
Bonteheuwel Secondary: 92.1%
Bridgetown Secondary: 72.4%
Buren High: 94.7%
Camps Bay High: 97.4%
Canons Creek: 100%
Cape Town High: 89.4%
Cathkin Secondary: 83.3%
City Mission Educational Services: 75%
Claremont High: 100%
Crystal Secondary: 77.9%
Damelin College: 94.2%
Darul Islam Islamic High: 90.9%
Dominican Grimley: 100%
Fezeka Secondary: 71.9%
Gardens Commercial High: 99.1%
Garlandale Secondary: 76.1%
Good Hope Seminary High: 98.5%
Groenvlei Secondary: 81.9%
Groote Schuur High: 98.5%
Harold Cressy High: 88.5%
Heideveld Secondary: 81%
Heritage College: 100%
Herschel High: 100%
Herzlia High: 100%
Holy Cross Convent (Maitland): 95.7%
Houtbaai Secondary: 70.3%
I. D. Mkize Secondary: 63.8%
Ikamvalethu Secondary: 42.8%
Intshukumo Secondary: 62.9%
Isilimela Secondary: 66%
Islamia College: 99.1%
Jan Van Riebeeck High: 100%
Kensington Secondary: 97.5%
Kulani Secondary: 62.4%
Langa Secondary: 58%
Leap Science And Maths: 87.1%
Livingstone High: 100%
Maitland Secondary: 89.6%
Manenberg Secondary: 63.9%
Modderdam Secodnary: 56.8%
Mount View Secondary: 90.9%
Ned Doman High: 70.9%
Oaklands Secondary: 95.3%
Oude Molen High: 94.6%
Peak View Secondary: 89.4%
Phoenix Secondary: 68.9%
Pinelands High: 100%
Premier College: 78.2%
Queen`S Park High: 79%
Rhodes High: 82.4%
Rondebosch Boys` High: 100%
Rosmeade College: 56.3%
Rustenburg Girls` High: 100%
Rylands High: 97.1%
Salt River Secondary: 80.3%
Sans Souci Girls` High: 100%
School Of Hope: 62.5%
Sea Point High: 93.8%
Silverstream Secondary: 69.1%
South African College High: 100%
Spes Bona High: 85.3%
St Cyprian`s High: 100%
St Georges Grammar: 97.3%
St Joseph`s College: 100%
Star International High: 100%
Stonefountain College: 66.7%
Thandokhulu Secondary: 88%
Trafalgar Secondary: 80.6%
Vista High: 76.6%
Vista Nova: 100%
Voortrekker High: 100%
Walmer Secondary: 50.9%
Westerford High: 100%
Windermere Secondary: 65.4%
Windsor High: 93.3%
Y-2-K College: 97.9%
Zonnebloem Nest Secondary: 96.9%

Metro East District:
Bellville High: 100%
Blackheath Secondary: 78.6%
Boston Private: 86%
Brackenfell High: 99%
Bulumko Secondary: 78.4%
Centre Of Science And Technology: 100%
Chris Hani Secondary: 82.7%
De Kuilen High: 99.7%
Eersterivier Secondary: 82.9%
Esangweni Secondary: 50%
Forest Heights High: 67.8%
Good Hope High: 74.2%
Gordon Secondary: 81.6%
Harry Gwala Secondary: 55.2%
Helderberg High: 100%
Hottentots-Holland High: 96.5%
Intlanganiso Secondary: 94.1%
Iqhayiya Secondary: 84.6%
Jan Kriel-School: 94.4%
Joe Slovo Secondary: 69.1%
Khanyolwethu Secondary: 82.6%
Kleinvlei Secondary: 70.2%
Kwamfundo Secondary: 64.8%
Luhlaza Secondary: 82.4%
Macassar Secondary: 75%
Madrasatur Rajaa Strand High: 96.9%
Malibu Secondary: 78.9%
Manyano High: 80.9%
Manzomthombo Secondary: 78.9%
Masiyile Secondary: 89.6%
Matthew Goniwe Memorial High: 84.5%
Mondeor Eco School: 83.3%
Monument Park High: 98.8%
Natural Learning Academy: 100%
Parel Vallei High: 100%
Rusthof Secondary: 81.6%
Sarepta Secondary: 85.5%
Scottsdene Secondary: 68.1%
Scottsville Secondary: 50.5%
Simanyene Secondary: 64%
Sinako High: 63%
Siphamandla Secondary: 76.2%
Sizimisele Secondary: 61%
Somerset West Private: 97.4%
Strand Secondary: 81.8%
Strand High: 98.7%
The Equestrian Academy Of Cape Town: 100%
Thembelihle High: 56.5%
Tuscany Glen Secondary: 83.1%
Usasazo Secondary: 73.6%
Uxolo High: 52.7%
Valsbaai High: 100%
Western Cape Sport: 91%
Zandvliet High: 88.6%
Zola Secondary: 80.3%

Metro North District:
Abbotts College Milnerton: 96.5%
Athlone School for Blind: 62.5%
Atlantis Secondary: 71.2%
Bardale Secondary: 70.4%
Belhar Secondary: 82.6%
Bellville Hoër Tegniese Skool: 98.4%
Bellville-South Secondary: 84.9%
Bernadino Heights Secondary: 97.9%
Bishop Lavis Secondary: 78%
Bloekombos Secondary: 71.1%
Bloubergrant Secondary: 100%
Bosmansdam High: 100%
Cape Town Studies And Tours: 92.9%
Cbc St John`s Parklands: 100%
Cravenby Secondary: 87.2%
D.F. Malan High: 100%
Dr. Nelson R. Mandela High: 55.6%
Durbanville High: 96.9%
Eben Donges High: 92.6%
Edgemead High: 97.4%
Elsiesrivier Secondary: 94.2%
Elswood Secondary: 75%
Emmanuel Christian Academy: 95.2%
Excelsior Secondary: 96%
Fairbairn College: 100%
Fairmont High: 99.6%
Florida Secondary: 71%
Goodwood College: 96.4%
Hector Peterson Secondary: 59.5%
Hindle High: 95.8%
Inkwenkwezi Secondary: 84.5%
Iqra Academy: 92.3%
J.G. Meiring High: 96.9%
John Ramsay Secondary: 74.4%
Kasselsvlei Comprehensiewe High: 74%
Kuils River Technical Secondary: 81.2%
Leiden Secondary: 87.7%
Marian RC Secondary: 96.8%
Masibambane Secondary: 91.2%
Masibambisane Secondary: 47.5%
Melkbos Strand Private: 100%
Mfuleni Secondary: 53.6%
Milnerton High: 100%
Mountain View Academy: 100%
New Eisleben Secondary: 55.8%
Parklands College: 100%
Parow High: 97.5%
Perseverance Secondary: 87.7%
President High: 96.2%
Proteus Secondary: 81.9%
Range Secondary: 73%
Ravensmead Secondary: 97%
Riverside College: 100%
Robinvale High: 80.5%
Rosendaal Secondary: 88.7%
Saxonsea Secondary: 90.8%
Shiloh Centre Of Learning: 50%
Silversands Secondary: 72.4%
Simunye Secondary: 89.5%
Sinenjongo High: 93.4%
St. Andrew`s Secodnary: 57%
Stellenberg High: 99.7%
Sunningdale High: 100%
Symphony Secondary: 81.4%
Table View High: 99.4%
The Settlers High: 100%
Tygerberg High: 97.2%
Uitzig Secondary: 41.7%
Unity Christian Campus: 93.3%
Valhalla Secondary: 74.4%
Voorbrug Secondary: 79.6%
Wallacedene Secondary: 66.3%
Wesbank Secondary: 62.3%

Metro South District:
Aloe Secondary: 66.4%
Beacon Hill Secondary: 83.5%
Bergvliet High: 99%
Cape Academy For Maths Science And Tec: 98.6%
Cedar Secondary: 89%
Christel House: 97.6%
Constantia Waldorf: 100%
Crestway Secondary: 68.1%
Darul Argam Islamic High: 80%
Darun Na’im High: 100%
Fairmount Secondary: 78.8%
Fish Hoek Secondary: 99.5%
Focus College: 79.2%
Glendale Secondary: 77.8%
Grassdale High: 93.5%
Grassy Park Secondary: 80.2%
Heathfield High: 79.8%
Immaculata RK Secondary: 85.9%
Intsebenziswano Secondary: 70.2%
Lavender Hill Secondary: 83.3%
Lentegeur Secondary: 76.5%
Lotus Secondary: 65.9%
Masiphumelele High: 71.6%
Mondale High: 99.6%
Muizenberg High: 90.8%
Norman Henshilwood High: 99.3%
Ocean View Secondary: 92.2%
Oscar Mpetha High: 57.1%
Oval North Secondary: 88.2%
Pelican Park High: 93.5%
Phakama Secondary: 65.5%
Phandulwazi High: 68.9%
Phillipi Secondary: 70.8%
Plumstead High: 98.9%
Portland Secondary: 78.2%
Princeton Secondary: 66.3%
Rocklands Secondary: 74.1%
Shiloah Christian: 100%
Sibelius High: 73.6%
Simon Estes Music School: 30.4%
Simon`s Town: 94.9%
Sinethemba Secondary: 74.5%
Sithembele Matiso Secondary: 54.3%
Sophumelela Secondary: 71.7%
South Peninsula High: 100%
Spine Road Secondary: 99.5%
Springfield Convent Of The Holy Rosary: 100%
Steenberg Secondary: 94.1%
Strandfontein Secondary: 86.8%
Tafelberg High: 100%
Tafelsig Secondary: 79.1%
The Oracle Academy: 98.6%
Vuyiseka Secondary: 69.4%
Westridge Secondary: 81.5%
Wittebome High: 87.1%
Woodlands Secondary: 70.8%
Wynberg Secondary: 81.5%
Wynberg Boys` High: 97.8%
Wynberg Girls` High: 100%
Zeekoevlei Secondary: 89.7%
Zisukhanyo Secondary: 65.7%
Zwaanswyk High: 95.9%

Overberg District:
Albert Myburgh Secondary: 86.3%
Barrydale High: 81.8%
Bredasdorp High: 98.9%
De Rust Futura Academy: 94.1%
De Villiers Graaff High: 97.2%
Emil Weder Secondary: 95.3%
Gansbaai Academia: 93.2%
Grabouw High: 100%
Groenberg Secondary: 96.2%
Hawston Secondary: 88.4%
Hermanus High: 100%
Northcliff House College: 100%
Olyfkrans College: 100%
Overberg High: 100%
Qhayiya Secondary: 76.1%
Riviersonderend High: 100%
Swartberg Secondary: 82.4%
Swellendam Secondary: 78.8%
Swellendam High: 100%
Umyezo Wama Apile: 63.4%
Villiersdorp Secondary: 82.6%

West Coast District:
Augsburg Landbougimnasium: 100%
Cederberg Academy: 85.1%
Clanwilliam Secondary: 85%
Diazville High: 88.3%
Dirkie Uys High: 100%
Graafwater High: 100%
Hopefield High: 100%
Lutzville High: 100%
Morester Privaatskool: 100%
Naphakade Secondary: 41%
Nuwerus High: 85.2%
Piketberg High: 100%
Porterville High: 100%
Schoonspruit Secondary: 91.3%
Steynville Secondary: 72.5%
Swartland High: 99.3%
Vanrhynsdorp High: 89.4%
Velddrif High: 90%
Vredenburg High: 98.1%
Vredendal Secondary: 86.5%
Vredendal High: 100%
Wesbank Secondary: 93.3%
Weston Secondary: 83.6%

For more information and individual results check: Department of Basic Education

Monday 6 January 2014

Finished School, What Next?

Finished school and planning for your future? Check out some of these exciting opportunities!
Universities and FET Colleges
Have you thought about going to university?
The Western Cape has four universities that offer various courses:
Finished school but didn't get into university?
An alternative is to study at a Further Education and Training (FET) college. Here is a list of FET colleges in the Western Cape:
There are many other colleges offering courses for school leavers, but be careful - some are not accredited and don't offer recognised courses. The Department of Higher Education and Training has a helpline that you can contact to verify a FET college: 0800 872 2222.
Here is some more information about what you should look for before registering at a college:
  • Confirm the registration status of the college with the Department of Higher Education and Training.
  • Ask for a brochure with information about the college and the qualifications that it offers.
  • Study the student agreement carefully before enrolling.
  • Make sure you get information on semester and examination timetables.
  • Verify claims that the college offers internationally recognised qualifications.
  • Be on the lookout for the false use of the names of world-renowned colleges.
  • Check if a qualification that you want to register for has an NQF accreditation.
You should also look out for the use of the following terms:
Certificate
  • The minimum length of studying for a certificate is one academic year, which includes class attendance, studying at home, assignments and in-service training.
  • A qualification registered on the NQF must have a SAQA ID number.
  • A certificate means that the qualification is registered at Level 2, 3 or 4 of the NQF.
  • FET certificates consists of a minimum of 120 credits.
Diploma
  • The minimum length of studying for a diploma is two academic years, which includes class attendance, studying at home, assignments and in-service training.
  • A qualification registered on the NQF must have a SAQA ID number.
  • A diploma means that the qualification is registered at Levels 5 to 6 of the NQF.
  • A diploma consists of a minimum of 240 credits.
Start Your Own Business
Finished with school and thinking of starting your own business? Here is some information on finance and skills development opportunities, as well as help offered by various government organisations to young entrepreneurs.
Sector Education and Training Authority (SETA):
You can also contact the National Youth Development Agency (NYDA) for help with financing your business or developing an existing one.
A Career in the Police or Military
The South African Police Service (SAPS) offers careers in various fields. You can become a police official or a civilian employee. Most police officials are directly involved in preventing, combating or investigating crime. Other police officials and civilian personnel carry out support functions.

If you are interested in joining the South African Police Service, you need to meet the following requirements:
  • Be a South African citizen.
  • Have a Grade 12 (Standard 10) Senior Certificate.
  • Be at least 18 years old and under 30 years old.
  • Have a valid driver's licence.
  • No criminal record.
  • Be physically, mentally and medically fit.
  • Have good communication skills.
  • Act decisively and without hesitation.
  • Be a calm and even-tempered person.
The SAPS recruits throughout the year. Keep an eye on the Sunday newspapers for job adverts.
The Department of Defence employs young, fit and healthy South Africans. New members will serve for a two-year period. At the end of the two-year contract you can choose to carry on serving in the SANDF or to become a civilian again, although you will need to continue serving in the Reserve Force.

  • SA Army
  • SA Air Force
  • SA Navy
  • SA Military Health Service
  • Special Forces
If you are interested in joining the SANDF, you need to meet the following requirements:
  • Be a South African citizen.
  • Be between the ages of 18 and 22 (although graduates up to the age of 26 can also join).
  • Not area bound.
  • Have no criminal record.
  • Preferably single.
  • Medically fit.
  • Prepared for basic military training, functional training and to serve in uniform.
SANDF recruitment takes place in January and July every year.

Western Cape Preview on Matric Results 2013

Statement by Penny Vinjevold, Head of Education in the Western Cape
The Western Cape Education Department is looking forward with keen anticipation to the announcement of the 2013 National Senior Certificate exam results on Monday, 6 January.
Candidates will receive their individual results at schools from 12:00 on Tuesday, 7 January.
We have noted commentary in the media on the standard of marking and large increases in pass rates.
The WCED has applied rigorous standards to marking the exams, including testing of markers in 10 core subjects (see “Quality of Markers” below).
We are confident that the results will be a true and accurate reflection on the abilities of our candidates, consistent with trends in improvement in the Western Cape in recent years (see Tables 1 and 2 below).
The WCED will use four key criteria to assess the overall results. They are:
  • The numbers passing
  • The numbers passing with quality results
  • Any decline in the number of underperforming schools
  • The numbers passing in poor communities
The numbers passing
The WCED is committed to increasing the number of candidates passing matric and with good results.
This is not the same as improving the pass rate. You can improve a pass rate by encouraging your weakest candidates to drop out of school.
Critics have accused schools of this practice, referring to it as “gaming” or “culling”.
We actively discourage this practice. We are committed to supporting our weakest learners and to ensuring that as many candidates as possible are given every opportunity to write matric.
Results to date have shown that the Western Cape is succeeding in this mission. For example, the number of candidates passing matric has increased steadily from 34 017 full-time candidates in 2009 to 36 992 in 2012.
Our stretch target for 2013 is 40 000.
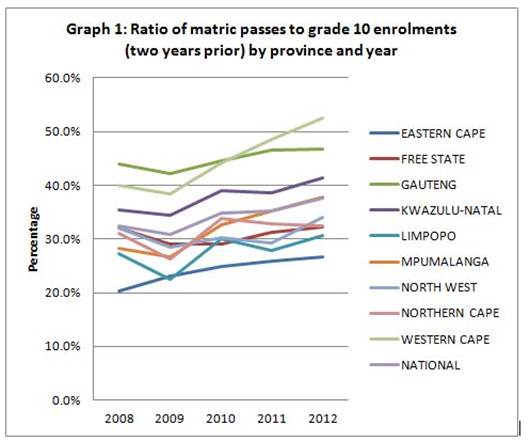
Figure 1 below reflects the Western Cape’s success in retaining learners to matric during the period 2009 to 2012. We hope to see this trend continued in the 2013 results.
Figure 1
Figure 1: Retention of Grade 10 learners per province, 2008 to 2012. Retention in the Western Cape improved from 39.9% in 2008 to 52.5% in 2012. Source: Politicsweb, “The ‘real’ matric pass rate?”, 30 June 2013.
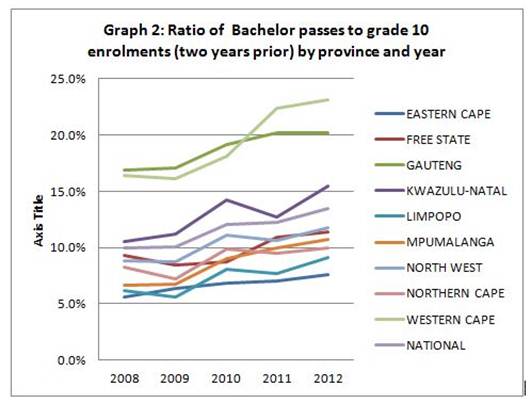
Figure 2
Figure 2: Ratio of Bachelor passes to Grade 10 enrolments, 2008 to 2012. The ratio improved in the Western Cape from 16.4% to 23.2%. Source: Politicsweb, “The ‘real’ matric pass rate?”, 30 June 2013.
Number of quality passes
We determine the quality of the results by increases in the numbers of candidates qualifying for Bachelor degree studies and our Mathematics and Physical Science results.
The number of candidates qualifying for Bachelor degree studies has increased from 14 414 in 2009 to 16 319 in 2012.
The pass rate for Mathematics in the Western Cape has improved from 64.9% in 2009 to 73.3% in 2012, thanks to sustained support in line with our Maths and Science strategy.
The pass rate for Physical Science improved similarly from 52.8% to 72.6% during this time.
Underperforming schools
The WCED defines underperforming high schools as those that achieve matric pass rates of less than 60%.
The department has applied interventions to support these schools. As a result, the number of underperforming schools in the Western Cape has dropped from 85 in 2009 to 26 in 2012.
We hope to see a further reduction this year.
While applying special interventions, we are also improving the system as a whole, for example, through our comprehensive literacy and numeracy strategy in primary schools.
Other more sustainable measures to improve the system, rather than bandaids, include, for example, ensuring that all learners have textbooks, careful selection of principals and teachers, their support, and further support to Grade 10 learners.
We are improving the system progressively to improve the system as a whole in the medium to longer terms.
Numbers passing in poor communities
A true test of our system is the extent to which we improve life opportunities for young people in poor communities.
Results have improved significantly in certain communities, for example, in Khayelitsha in recent years, and we will study the results closely to see if this trend has continued.
Quality of markers
The WCED has applied measures to ensure rigorous marking and that the results will be a fair and accurate reflection of the abilities of our candidates.
For example, the Western Cape has applied competency testing for markers for the past three years and is the only province to have done so.
The aim of the tests has been to ensure the highest possible standard of marking and that all of our markers are competent and experienced in their fields.
The WCED tested markers in 10 subjects in 2013, namely, Mathematics, Mathematical Literacy, Physical Sciences, History, Life Sciences, Accounting, Business Studies, Geography and Consumer Studies.
The competency tests assessed content knowledge, application of knowledge and skills and marking abilities. They focused on more than content knowledge by also testing the ability of markers to interpret Grade 12 candidate responses.
We are committed to ensuring the credibility and integrity of the exams at every level. The credibility of marking is central to this process.
Conclusion
Critics agree that we have to move beyond the pass rate as the main criterion for assessing matric results.
The WCED has adopted this approach for several years now, focussing instead on increasing the actual number of learners passing through the system, and passing matric with good results.
Results to date have shown that we are making progress. We look forward to seeing whether this trend has continued with the latest results.
Table 1: Western Cape National Senior Certificate Results 2009 – 2012
Year
Entered
Wrote
Pass
% pass
Bachelor
% pass Bachelor
Schools below 60%
2009
46 862
44 931
34 017
75.7%
14 324
31.9%
85
2010
47 062
45 783
35 139
76.7%
14 414
31.5%
78
2011
41 261
39 988
33 146
82.9%
15 215
38.0%
30
2012
45 562
44 670
36 990
82.8%
16 317
36.5%
26

Table 2: Western Cape National Senior Certificate Results 2009 – 2012: Mathematics and Physical Science
Year
Maths total
Maths %
PhSc total
PhSc %
2009
12 467
64.9%
7 064
52.9%
2010
11 571
66.0%
7 524
59.6%
2011
9 820
68.7%
7 137
65.3%
2012
11 311
73.5%
7 995
70.9%