
Statement by Penny Vinjevold, Head of Education in the Western Cape
The Western Cape Education Department is looking forward with keen anticipation to the announcement of the 2013 National Senior Certificate exam results on Monday, 6 January.
Candidates will receive their individual results at schools from 12:00 on Tuesday, 7 January.
We have noted commentary in the media on the standard of marking and large increases in pass rates.
The WCED has applied rigorous standards to marking the exams, including testing of markers in 10 core subjects (see “Quality of Markers” below).
We are confident that the results will be a true and accurate reflection on the abilities of our candidates, consistent with trends in improvement in the Western Cape in recent years (see Tables 1 and 2 below).
The WCED will use four key criteria to assess the overall results. They are:
- The numbers passing
- The numbers passing with quality results
- Any decline in the number of underperforming schools
- The numbers passing in poor communities
The numbers passing
The WCED is committed to increasing the number of candidates passing matric and with good results.
This is not the same as improving the pass rate. You can improve a pass rate by encouraging your weakest candidates to drop out of school.
Critics have accused schools of this practice, referring to it as “gaming” or “culling”.
We actively discourage this practice. We are committed to supporting our weakest learners and to ensuring that as many candidates as possible are given every opportunity to write matric.
Results to date have shown that the Western Cape is succeeding in this mission. For example, the number of candidates passing matric has increased steadily from 34 017 full-time candidates in 2009 to 36 992 in 2012.
Our stretch target for 2013 is 40 000.
Figure 1 below reflects the Western Cape’s success in retaining learners to matric during the period 2009 to 2012. We hope to see this trend continued in the 2013 results.
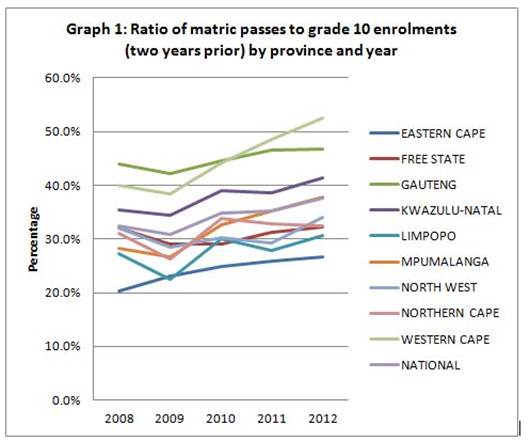
Figure 1: Retention of Grade 10 learners per province, 2008 to 2012. Retention in the Western Cape improved from 39.9% in 2008 to 52.5% in 2012. Source: Politicsweb, “The ‘real’ matric pass rate?”, 30 June 2013.
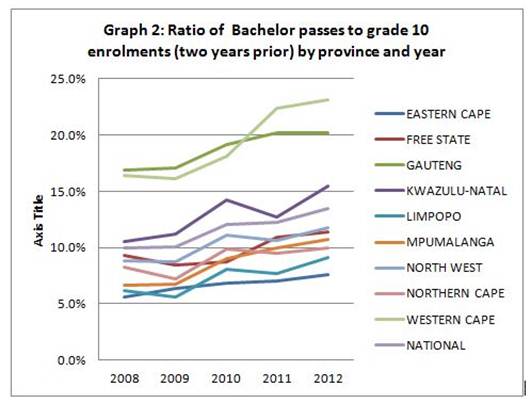
Figure 2: Ratio of Bachelor passes to Grade 10 enrolments, 2008 to 2012. The ratio improved in the Western Cape from 16.4% to 23.2%. Source: Politicsweb, “The ‘real’ matric pass rate?”, 30 June 2013.
Number of quality passes
We determine the quality of the results by increases in the numbers of candidates qualifying for Bachelor degree studies and our Mathematics and Physical Science results.
The number of candidates qualifying for Bachelor degree studies has increased from 14 414 in 2009 to 16 319 in 2012.
The pass rate for Mathematics in the Western Cape has improved from 64.9% in 2009 to 73.3% in 2012, thanks to sustained support in line with our Maths and Science strategy.
The pass rate for Physical Science improved similarly from 52.8% to 72.6% during this time.
Underperforming schools
The WCED defines underperforming high schools as those that achieve matric pass rates of less than 60%.
The department has applied interventions to support these schools. As a result, the number of underperforming schools in the Western Cape has dropped from 85 in 2009 to 26 in 2012.
We hope to see a further reduction this year.
While applying special interventions, we are also improving the system as a whole, for example, through our comprehensive literacy and numeracy strategy in primary schools.
Other more sustainable measures to improve the system, rather than bandaids, include, for example, ensuring that all learners have textbooks, careful selection of principals and teachers, their support, and further support to Grade 10 learners.
We are improving the system progressively to improve the system as a whole in the medium to longer terms.
Numbers passing in poor communities
A true test of our system is the extent to which we improve life opportunities for young people in poor communities.
Results have improved significantly in certain communities, for example, in Khayelitsha in recent years, and we will study the results closely to see if this trend has continued.
Quality of markers
The WCED has applied measures to ensure rigorous marking and that the results will be a fair and accurate reflection of the abilities of our candidates.
For example, the Western Cape has applied competency testing for markers for the past three years and is the only province to have done so.
The aim of the tests has been to ensure the highest possible standard of marking and that all of our markers are competent and experienced in their fields.
The WCED tested markers in 10 subjects in 2013, namely, Mathematics, Mathematical Literacy, Physical Sciences, History, Life Sciences, Accounting, Business Studies, Geography and Consumer Studies.
The competency tests assessed content knowledge, application of knowledge and skills and marking abilities. They focused on more than content knowledge by also testing the ability of markers to interpret Grade 12 candidate responses.
We are committed to ensuring the credibility and integrity of the exams at every level. The credibility of marking is central to this process.
Conclusion
Critics agree that we have to move beyond the pass rate as the main criterion for assessing matric results.
The WCED has adopted this approach for several years now, focussing instead on increasing the actual number of learners passing through the system, and passing matric with good results.
Results to date have shown that we are making progress. We look forward to seeing whether this trend has continued with the latest results.
Table 1: Western Cape National Senior Certificate Results 2009 – 2012
Year
|
Entered
|
Wrote
|
Pass
|
% pass
|
Bachelor
|
% pass Bachelor
|
Schools below 60%
|
2009
|
46 862
|
44 931
|
34 017
|
75.7%
|
14 324
|
31.9%
|
85
|
2010
|
47 062
|
45 783
|
35 139
|
76.7%
|
14 414
|
31.5%
|
78
|
2011
|
41 261
|
39 988
|
33 146
|
82.9%
|
15 215
|
38.0%
|
30
|
2012
|
45 562
|
44 670
|
36 990
|
82.8%
|
16 317
|
36.5%
|
26
|
Table 2: Western Cape National Senior Certificate Results 2009 – 2012: Mathematics and Physical Science
Year
|
Maths total
|
Maths %
|
PhSc total
|
PhSc %
|
2009
|
12 467
|
64.9%
|
7 064
|
52.9%
|
2010
|
11 571
|
66.0%
|
7 524
|
59.6%
|
2011
|
9 820
|
68.7%
|
7 137
|
65.3%
|
2012
|
11 311
|
73.5%
|
7 995
|
70.9%
|
No comments:
Post a Comment